The Exorcist
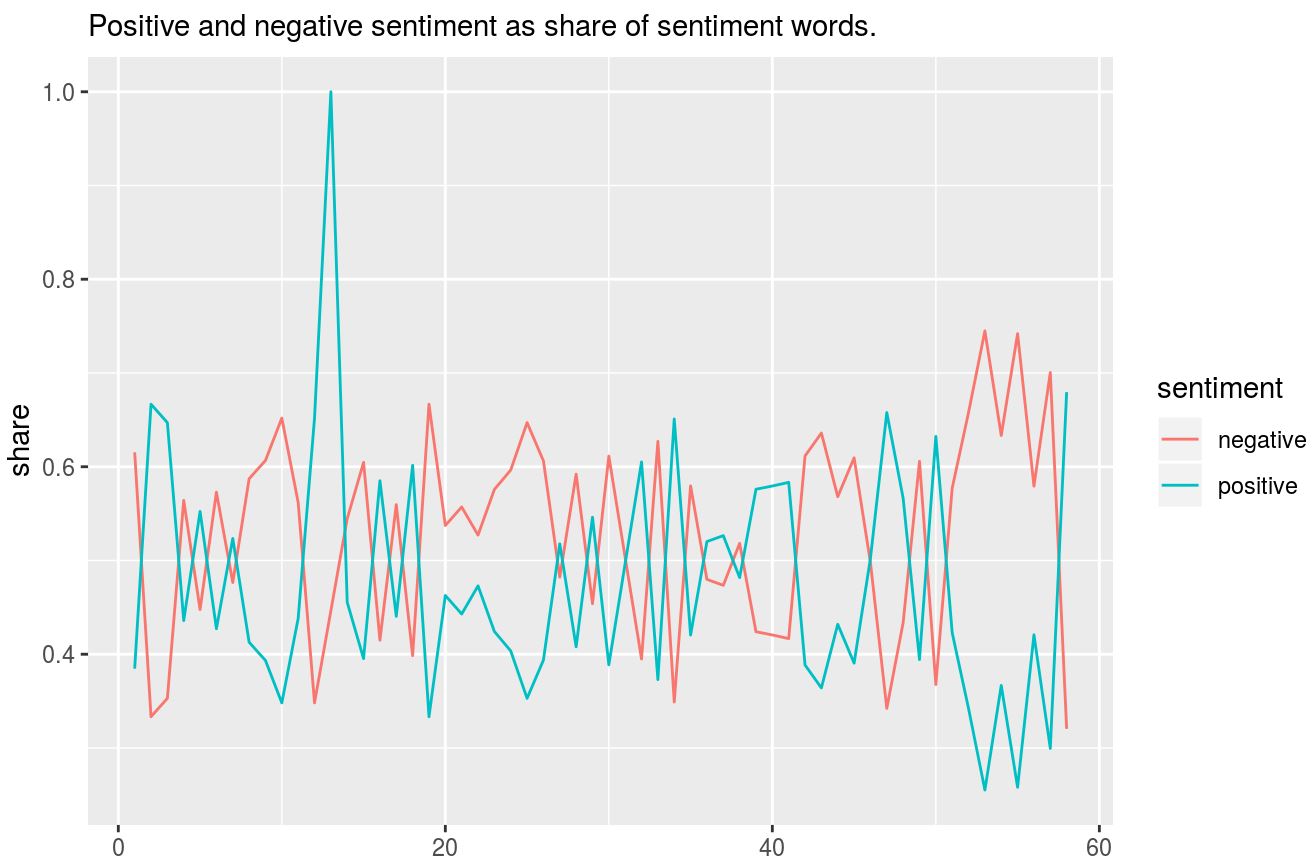
The film begins on a positive note as we are introduced to Chris and Reagan. Darker themes soon come out when Reagan finds the old game box in the basement and begins to mention Howdy. Good sentiment spikes soon after during the party and other scenes of relief. Soon negative sentiment comes back on top as Reagan begins to become possessed. At the end of the film, we see the large separation of good and bad sentiment. This is when Fr. Karras faces off against Pazuzu and then ultimately dies. Reagan becomes freed from the demon and the movie ends on a final spike of positivity.